Viewing Job Results
When a job has completed, from the Job Manager page click either the job name or the View Job icon ( ).
).
Viewing Molecular Orbitals
Molecular orbitals and related quantities are displayed on the View Results page in the Molecule Viewer tab of the 3-D visualizer.
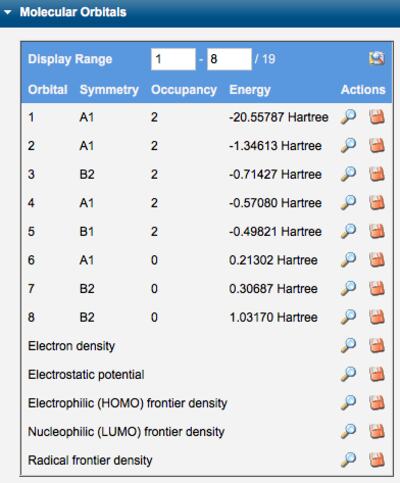
The symmetry, occupancy, and energy of each orbital is tablulated in the Molecular Orbitals section of Calculated Quantities. Individual orbitals may be displayed by clicking the corresponding View icon (). The electron density, electrostatic potential, and electrophilic/nucleophilic/radical frontier densities may also be displayed. The orbital definitions (basis functions and linear combination coefficients) may be saved locally by clicking the Download icon ( ).
).
Tables of Molecular Orbitals
The orientation of the orbital is controlled by choosing View:Rotate ( ) and dragging in the x-y plane or alt-dragging horizontally for z-axis rotation. The location of the orbital is controlled by choosing View:Translate (
![]() ) and dragging vertically. The orbital zoom is controlled by choosing View:Zoome (
) and dragging vertically. The orbital zoom is controlled by choosing View:Zoome ( ) and dragging vertically.
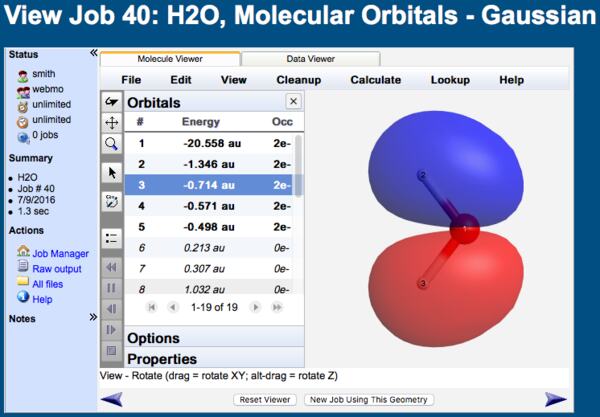
MO Viewer
When the Orbitals list is displayed in the Molecule Viewer, clicking on any particular orbital will display it.
Interpreting Molecular Orbital Images
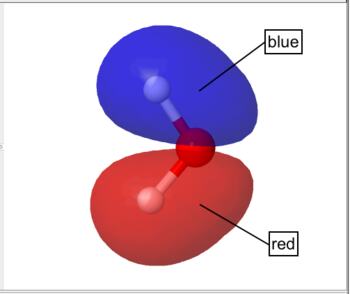
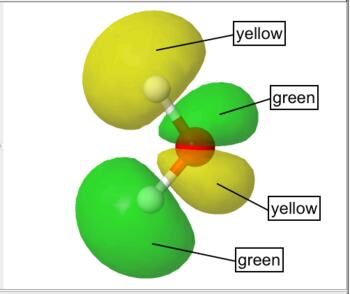
By default WebMO represents occupied orbitals in red/blue and unoccupied orbitals in yellow/green.
 Occupied Orbital |
 Unoccupied Orbital |
The electron density is computed from the sum of squares of occupied molecular orbitals. The electron density isosurface represents the size and shape of the molecule.
The electrostatic potential is the energy that a unit charge at each point in space would have due to the surrounding electrons and nuclei, which is computed by integrating the electron density divided by distance at each point in space. The electrostatic potential is typically "painted" on the electron density isosurface.
By default WebMO represents smaller values by red and larger values in blue. Thus, red represents negative regions and blue represents positive regions on an electrostatic potential surface. For example, the electrostatic potential surface on water is red (negative) around oxygen and blue (positive) around the hydrogens. A color legend is provided to illustrate how numeric values correspond to color.
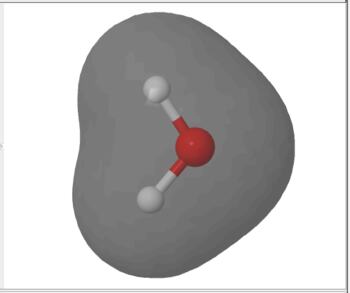 Electron Density Surface |
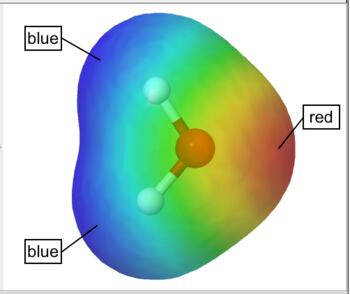 Electrostatic Potential Surface |
Frontier density surfaces are computed from the magnitudes of the molecular orbitals available for attack by an electrophile, nucleophile, or radical. The result is a "bull's eye" pattern with blue representing the largest probability of attack. For example, the electrophilic (HOMO) frontier density of surface of formaldehyde is blue (maximum value) around the oxygen. the surface indicates that protonation will occur at the oxygen in the molecular plane. The nucleophilic (LUMO) frontier density of surface of formaldehyde is blue (maximum value) around carbon. The surface indicates that nucleophilic attack will occur at the carbon out of the molecular plane.
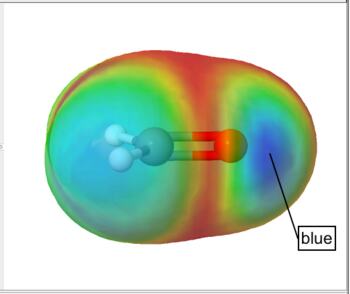 Electrophilic (HOMO) Frontier Density Surface |
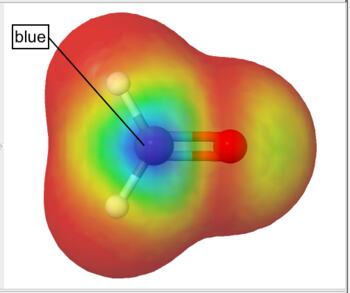 Nucleophilic (LUMO) Frontier Density Surface |
Interpreting Colors
For orbitals, colors indicate opposite phase. For color scales, smaller values are red and larger values are blue by default.
| Surface | Color | Interpretation |
|---|---|---|
| Molecular Orbital | Red/Blue | occupied orbital |
| Green/Yellow | unoccupied orbital | |
| Electron Density | Gray | isosurface |
| Electrostatic Potential | Red | negative region |
| Blue | positive region | |
| Electrophilic (HOMO) Frontier Surface | Blue | region most susceptible to attack by a electrophile |
| Nucleophilic (LUMO) Frontier Surface | Blue | region most susceptible to attack by a nucleophile |
| Radical Frontier Surface | Blue | region most susceptible to attack by a radical |
Color Interpretation of Surfaces
The WebMO color convention is that small ↔ large values are mapped onto red ↔ blue colors. To remember this, think about photon energy, i.e., red photons have less energy than blue photons!
Adjusting View Preferences
The orbital image displayed can be highly customized though the Preferences and the molecular orbital Options selections. Preferences are remembered across sessions, while Options are remembered only for the current session.
The Preferences dialog is available under File:Preferences... or the Preferences icon ( ) in the toolbar. The Preferences dialog allows control over molecular orbital:
- Isosurface values
- Transparency
- Colors
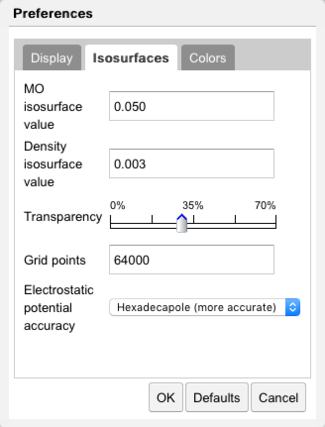 Isosurface Preferences |
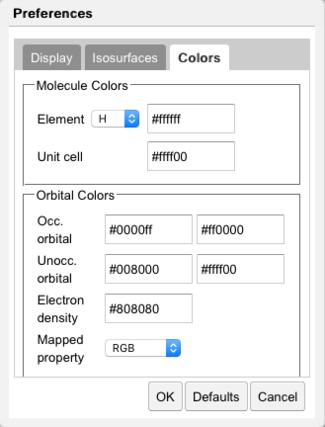 Color Preferences |
The size of the orbital is determined by the value of the isosurface to be plotted. Generally speaking a smaller isosurface value results in a larger orbital, since the orbital magnitude decreases with distance from the molecule. Isosurface values for molecular orbitals (MO) and electron density (ED) are specified in the Isosurfaces tab. The isosurface transparency may be set here. The number of grid points, which controls the smoothness of the surface, is specified here.
Colors of the occupied and unoccupied orbitals may be controlled in the Colors tab. Color schemes available for mapping values include RGB and Gradient. In RGB, small (negative) values are red, intermediate (zero) values are green, and large (positive) values are blue. In Gradient, intermediate (zero) values are gray.
The Options selections are available when a molecular orbital is being displayed. Click the Options category under the Orbitals list. The Options selection allows control over molecular orbital:
- Molecule and surface display
- Color map scaling
- Slices
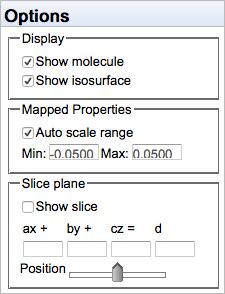
MO options
By default, the color↔value mapping is autoscaled, so that the minimum and maximum values of the isosurface are represented by red and blue, respectively. However, one can manually specify the numerical values to be represented by red and blue, which is useful for using the same mapping scheme on different molecules.
A plane may be defined for displaying values on a slice. See below.
Generating Other Images
Visualizing orbitals, potentials, and densities requires that 4 quantities, x, y, z, and f(x,y,z), be displayed on a 2-dimensional screen. Color helps with a 3rd dimension, but there are different choices for what data is not displayed! An orbital and electron density displays one value, f(x,y,z)=constant, in 3-D space but ignores the other values of f(x,y,z). Electrostatic potentials and frontier densities display the full f(x,y,z) range as colors on a curved isosurface but ignore other other regions of space.
Another possibility is to display the full f(x,y,z) range as colors on a 2-D plane or "slice", similar to a contour map. The WebMO Viewer allows one to easily sweep this plane through space along the remaining dimension, yielding a dynamic view of the 4-D information.
Orient the molecule so that the "slice" is the plane of the screen. Click the orbital display Options item. Round off the a, b, and c values to the nearest integer (this defines the slice plane relative to the molecular axes). Uncheck Show isosurface, and check Show slice. Rotate the molecule to a desirable orientation. Use the Position slider (which controls the value of d) to sweep the slice through the molecule.

MO slice